Grade a knee X-ray in seconds
Two custom neural networks estimate the Kellgren–Lawrence grade, from 0 (healthy) to 4 (severe), and show which parts of the joint drove the result.
Everything runs inside your browser: X-rays never leave your device, and every analysis is saved to this browser's history.
Recent analyses
Open historyGrades in your history
About the model
Tested once on 1,656 held-out X-rays: balanced accuracy 0.644 (95% CI 0.621 to 0.666) and quadratic weighted kappa 0.753. Severe osteoarthritis is recognized in 96% of cases; separating grades 0, 1 and 2 remains the hardest part.
X-ray
- Read the image
- Preprocess and grade
- Compute the heatmap
- Save to history
No X-ray at hand? Try one of these
Shown unmodified, with their dataset labels. Source: Chen (2018), Mendeley Data, CC BY 4.0.
All figures come from a single evaluation on 1,656 held-out test X-rays, run after the pipeline was frozen. Intervals are 95% bootstrap confidence intervals.
Performance by grade
Confusion matrix
Rows: true grade. Columns: predicted.Training curves
Validation data, both ensemble membersHow the final pipeline was chosen
Validation setDataset grade distribution
Can the heatmaps be trusted?

What KneeGrade does
KneeGrade estimates the severity of knee osteoarthritis on the Kellgren–Lawrence (KL) scale from a front-view knee X-ray, and shows a heatmap of the regions that most influenced the result. It was built as a machine-learning portfolio project: both networks were designed and trained from scratch, without pretrained weights.
The Kellgren–Lawrence scale
Dataset
8,260 knee X-rays from the Osteoarthritis Initiative, cropped to the joint at 224×224 pixels: 5,778 for training, 826 for validation and 1,656 for the final test. Grade 4 makes up only 3% of the training data, a 13-to-1 imbalance against grade 0, which is why the model is judged on balanced accuracy.
Chen, Pingjun (2018). Knee Osteoarthritis Severity Grading Dataset. Mendeley Data, V1. DOI 10.17632/56rmx5bjcr.1. Licensed under CC BY 4.0. Organized from the Osteoarthritis Initiative. Images were preprocessed and augmented for training. Neither the dataset authors nor the OAI endorse this project.
How an X-ray is graded
- Standardize the image. It is converted to 224×224 grayscale. Inverted X-rays (110 in the dataset) are detected and flipped back.
- Normalize contrast. Brightness is stretched using the central joint region, then CLAHE sharpens local bone edges. This removes scanner exposure differences.
- Run two networks. Both predict a probability for each grade, and the two predictions are averaged. They run on your own device with TensorFlow.js, producing the same results as the original Python pipeline.
- Correct for rarity. Each probability is divided by how common that grade was in training. This stops the model from defaulting to common grades, and it is why the predicted grade is occasionally not the tallest bar.
- Explain. Grad-CAM highlights the regions that most influenced the predicted grade.
Model architecture
| Stage | Layers | Output |
|---|---|---|
| Input | Grayscale X-ray | 224 × 224 × 1 |
| Block 1 | 2 × (3×3 convolution, batch norm, ReLU), max pooling | 112 × 112 × 32 |
| Block 2 | Same pattern | 56 × 56 × 64 |
| Block 3 | Same pattern | 28 × 28 × 128 |
| Block 4 | Same pattern | 14 × 14 × 256 |
| Head | Global average pooling, dropout 0.3, softmax | 5 grades |
The first network has 1,175,845 parameters. The second uses the same design 1.5 times wider (48 to 384 filters). Both were trained with the Adam optimizer, augmentation (flips, small rotations, shifts, zoom, brightness and contrast changes), and checkpoints chosen by validation balanced accuracy.
Limitations
- Trained and tested on a single source, the Osteoarthritis Initiative. Performance on other hospitals, scanners or populations is unknown.
- Grade 1 ("doubtful") is not reliably separated from grades 0 and 2. On the test set, 46% of healthy knees were graded 1.
- The public data has no patient identifiers, so one patient's two knees may sit in different splits, which could make results slightly optimistic.
- The model grades any image it receives. Results for anything other than a front-view knee X-ray cropped to the joint are meaningless.
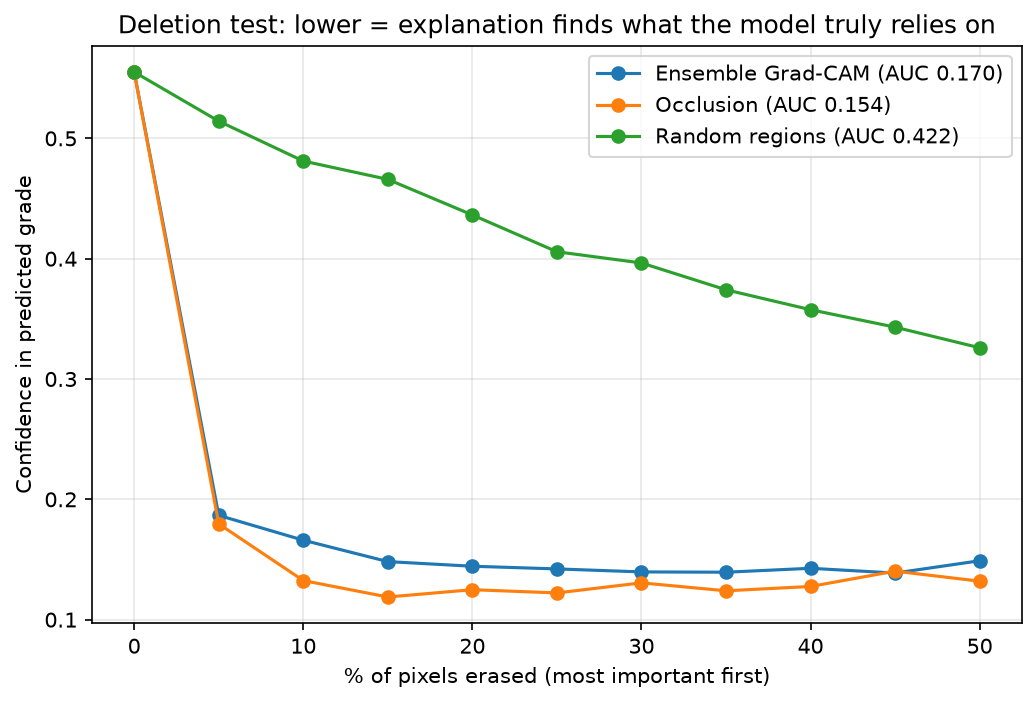
- Heatmaps were tested for faithfulness but not checked against expert lesion annotations.
Your data
KneeGrade has no server. The models download to your browser once, and every X-ray is analyzed on your own device: images are never uploaded anywhere. Your history is saved only in this browser, so it survives refreshes but isn't shared across devices. Clearing your browser's site data, or using Clear history, removes it.
Links
Model card on Hugging Face
Source code and full write-up on GitHub